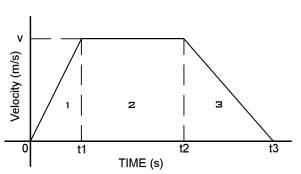
KinematicsVelocity - Time GraphContents Sometimes it is useful in solving problems in kinematics if a velcoity - time graph is drawn first. For example, if a body accelerates uniformly from rest, then travels at a constant velocity v before retarding uniformly to rest again the graph (fig:1)will take the folowing shape:
Note: The section numbers below relate to those of the graph above. Section 1 acceleration is given by: Therefore
The slope of the graph = acceleration Simimlarly for distance travelled: Therefore Distance travelled is given by the area under the graph for section 1. Section 2 Distance travelled: Section 3 As in sections 1. and 2. the distance travelled is given by the area under the graph for this The acceleration is given by: Note that this time the slope of the graph and acceleration are negative because the body is slowing down. |